JMeter Performance Testing Tutorial
Performance testing is crucial to determine that the web application under test will satisfy high load requirements. It can be used to analyze overall site performance under heavy load. Performance testing can be executed with the help of JMeter, since it offers following benefits:
Configure Performance Testing Environment for a website on JMeter
Following are the steps carried out in performance testing:
- JMeter can be used to test performance of both static resources such as JavaScript and HTML, as well as dynamic resources, such as JSP, Servlets, and AJAX
- JMeter can discover maximum number of concurrent users that your website can handle
- JMeter provides a variety of graphical analyses of performance reports
Configure Performance Testing Environment for a website on JMeter
Following are the steps carried out in performance testing:
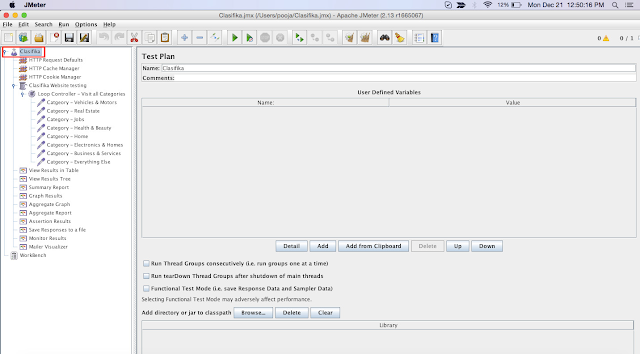
- Test Plan Setup
- HTTP Request Defaults
Setting the HTTP Request Default Element will cause all other Request Sampler within this My Users to access to the same server. However, it does not make requests - it simply sets the request default for this Thread.
- HTTP Cache Manager
Web-browsers have some mechanisms which allow for the reduction of traffic over the Internet. One such item is the caching of resources downloaded from the network, for use in the subsequent requests without triggering the web-server. That's why it's extremely important to reproduce the same behavior while creating a performance test.
We use HTTP Cache Manager here, while testing for first time, when a certain URL is requested from the server, JMeter saves the results to RAM.
When the attribute “Clear cache each iteration” is checked JMeter undergoes caching or else for every start of thread we undergo caching.
- HTTP Cookie Manager
HTTP Cookie Manager stores and sends cookies just like a web browser. If you have an HTTP Request and the response contains a cookie, the Cookie Manager automatically stores that cookie and will use it for all future requests to that particular web site. Each JMeter thread has its own "cookie storage area". So, if you are testing a web site that uses a cookie for storing session information, each JMeter thread will have its own session.
When the attribute “Clear cookies each iteration” is checked JMeter stores cookies for every thread.
- Thread Group
A Thread group defines a pool of users that will execute a particular test case against your server. Each thread simulates a user and the ramp-up period specifies the time to create all the threads. For example with 5 threads and 10 seconds of ramp-up time, it will take 2 seconds between each thread creation.
For our website, we have kept Number of Threads(users) = 1 and Ramp-Up Period(in seconds) = 1
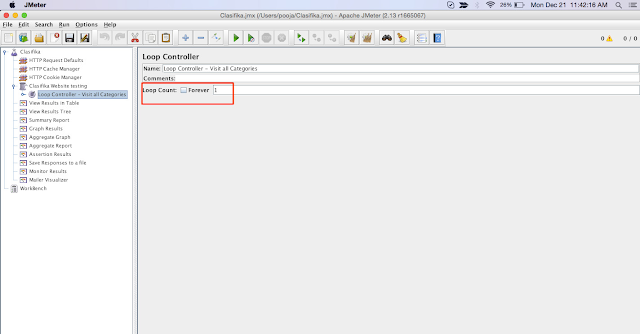
- Logic Controller - Loop Controller
Logic Controllers let you define the order of processing Samplers in a Thread, as you customize the logic that JMeter uses to send requests. A Logic Controller changes the order of requests that come from its sub-elements, or child elements. The child elements of a Logic Controller may comprise Samplers, Configuration Elements, and more Logic Controllers.
For the below website, we have added Loop Controller which specifies how many times loop for requests has to be repeated. We have kept it as 1 here.
- HTTP Request
This sampler lets you send an HTTP/HTTPS request to a web server. It also lets you control whether or not JMeter parses HTML files for images and other embedded resources and sends HTTP requests to retrieve them.
For our project, we have configured HTTP request for each category on homepage. We have considered 8 categories. This may vary project to project. Basically categories could be the different links, web pages that needs to be tested for performance.
- Analytics - View Results in Table
The View Results in Table shows row wise results of all sample responses. Sample responses consists of Start Time, Sample Time, status, Bytes, Latency, Connect Time
- Analytics - View Results Tree
The View Results Tree shows a tree of all sample responses, allowing you to view the response for any sample. In addition to showing the response, you can see
- Analytics - Aggregate Graph
Aggregate graph provides an easy way to generate bar graphs and save the graph as a PNG file. There are 2 options available here - Display Graph and Save Graph.
When we click on Display Graph option we can see the graph here. When we click on Save Graph button, results are saved as graph in the form of png file.
Guest Author


.png)


